The cheapest forecasting mistake is believing that a complicated model will repair weak retail data. It will not. For a small fashion team, the first useful forecast usually comes from four ordinary practices: a consistent weekly sales table, an explicit stockout flag, a simple baseline, and a decision that can be evaluated later.
You do not need an enterprise planning suite to begin. You do need to separate what was demanded from what was merely available to sell.
Start with one decision
“Forecast demand” is too broad. Choose a decision such as:
- how many units of a replenishable style to reorder;
- which size curve to use for the next production run;
- how much safety stock to hold before a promotion;
- when to stop replenishing a seasonal color;
- how to allocate a limited receipt across two channels.
The forecast horizon must match the decision lead time. A four-week reorder decision needs a different model and error tolerance than a six-month initial buy.
Build the minimum weekly table
Use one row per style or variant per week with:
week, item_id, units_sold, ending_inventory, stockout_days, selling_price, promotion, returns, channel, launch_flag, holiday_or_event.
The stockout field matters because recorded sales are censored when an item is unavailable. Zero sales during seven stockout days do not mean zero demand. Returns should be tracked separately so the team can compare gross demand, net demand, and operational revenue without silently mixing them.
Beat a simple baseline first
Before using AI, create a forecast that repeats a recent comparable period. Examples include:
- last week;
- the average of the last four in-stock weeks;
- the same week last year for a stable replenishment item;
- the median of recent comparable stores or channels.
The accompanying FashionMember example uses synthetic weekly demand and a four-week moving-average baseline. It is intentionally modest. Run:
php scripts/fm008-seasonal-baseline.php content/data/FM-008-weekly-demand.csvThe script holds out the last four weeks, creates forecasts using only earlier observations, and reports mean absolute error and weighted absolute percentage error. The data are fictional and demonstrate the method, not a retail benchmark.
Add a model only when it improves the decision
Meta’s open-source Prophet models a trend with seasonal and holiday components and can tolerate missing data, trend shifts, and many outliers. Its own documentation says it works best when the series has strong seasonal effects and several seasons of history. That is a warning for young fashion styles: a product with eight weeks of sales and one influencer spike does not contain several seasons of stable evidence.
Google’s BigQuery ML provides ARIMA_PLUS, which automates frequency inference, missing-data handling, outlier and step-change adjustment, holiday effects, and multiple seasonal patterns. Google also documents TimesFM through AI.FORECAST as a model that can forecast without creating a separate model. These tools reduce implementation effort, but they do not remove the need for a valid holdout test or a sensible business hierarchy.
For a small team, an open-source notebook or warehouse SQL model can be enough. The correct choice is the simplest method that consistently improves the decision after costs and operational constraints are included.
Evaluate like a buyer, not a demo
Hold back the most recent comparable weeks. Fit the method without seeing them. Then compare forecast and actual demand using more than one view:
MAE — mean absolute error. Easy to explain in units. An MAE of six means the forecast missed by six units on average.
WAPE — weighted absolute percentage error. Sum the absolute errors and divide by total actual demand. It is useful across items with different volumes, but unstable when total demand is near zero.
Bias. Sum forecast minus actual. Persistent positive bias produces excess stock; persistent negative bias produces missed demand.
Decision cost. Translate error into markdown exposure, lost gross margin, expedited freight, or customer-service impact. A statistically better forecast may still create a worse buy if the reorder rule ignores minimums or lead time.
Show uncertainty
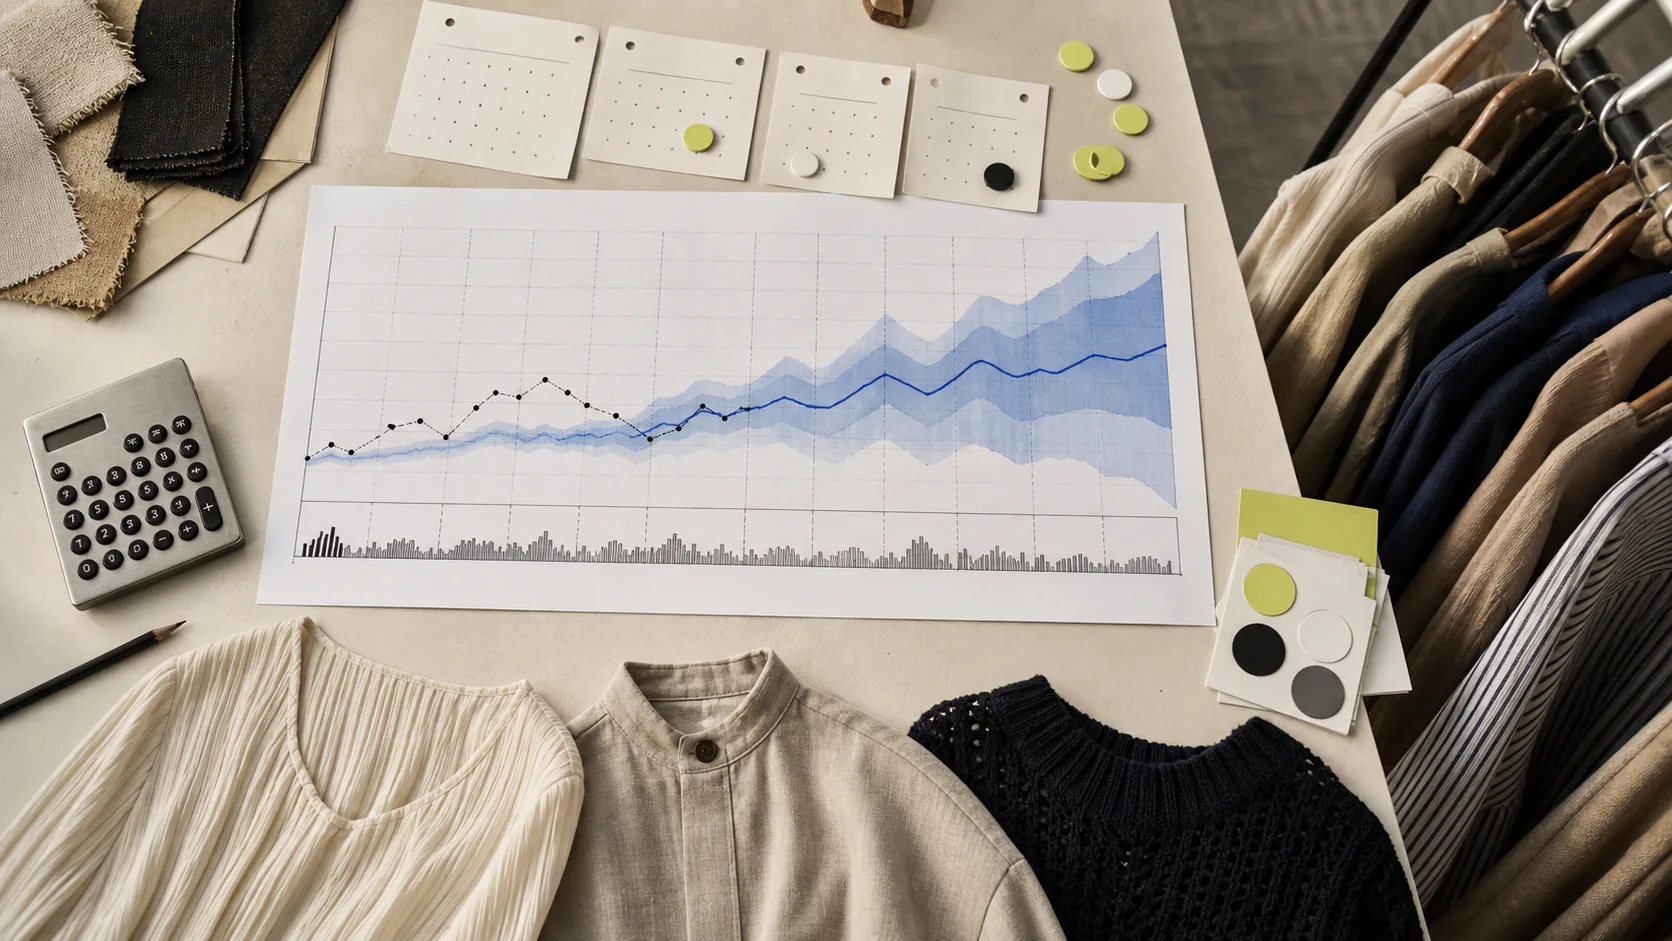
A single line encourages false precision. Forecasting tools can output intervals, but an interval is only as trustworthy as the assumptions behind it. Prophet’s paper notes that its trend uncertainty assumes future trend changes resemble the frequency and magnitude observed in history, and warns that the resulting intervals should not be expected to have exact coverage.
For a buying meeting, show at least three quantities:
- a central forecast;
- a plausible low and high range;
- the operational action at each range.
If the low case implies no reorder and the high case implies a large reorder, the real task is not choosing the prettiest forecast. It is reducing risk through a smaller test, shorter lead time, staged receipt, preorder signal, or transferable inventory.
A six-week implementation
Week 1: define one decision, item level, horizon, and error cost.
Week 2: create the weekly table and flag stockouts, promotions, launches, and returns.
Week 3: run a moving-average or seasonal-naive baseline.
Week 4: test one additional method such as Prophet or ARIMA_PLUS on the same holdout periods.
Week 5: connect the forecast to an order rule that includes on-hand stock, on-order units, lead time, minimum order quantity, and a documented safety factor.
Week 6: review forecast error after the decision. Keep a log of overrides and the reason for each override.
Forecasting is a learning loop
The valuable asset is not a model file. It is a history of what the team predicted, what it decided, what happened, and why the two differed.
Start small, preserve the baseline, and make uncertainty visible. A modest forecast that changes a real buying decision—and can be audited later—is worth more than an enterprise-grade dashboard no one trusts.
Sources and verification
- Prophet: Forecasting at scale, accessed August 31, 2026.
- Prophet: Diagnostics, accessed August 31, 2026.
- Taylor and Letham: Forecasting at Scale, primary research paper.
- Google Cloud: Forecast a single time series with ARIMA_PLUS, accessed August 31, 2026.
- Google Cloud: Forecasting overview, accessed August 31, 2026.
How this story was checked
- Sources
- 5 linked records · View list
- Last verified
- Reporting desk
- FashionMember AI & Retail Desk
- Format
- Analysis
- AI assistance
- Used with editorial review; disclosed above.